How has the record industry changed in the last 50 years? Using the Whitburn Project spreadsheet I talked about yesterday, I’ve been trying to dig into some of the underlying trends. Today, I’ll be tackling the longevity and diversity of pop songs, and a look at which decades had one-hit wonders.
Longevity of a Pop Song
One of the trickier questions I’ve been trying to visualize is how long pop songs are staying on the charts relative to the past. Are they staying on the charts longer than in the past?
In the chart below, I plotted the total number of weeks charted for all 23,924 songs that appeared on the Billboard Hot 100 from 1957 to earlier this year. (In other words, a little dot on the “60” line means there was a song released that week that stayed on the Hot 100 chart for 60 weeks.)
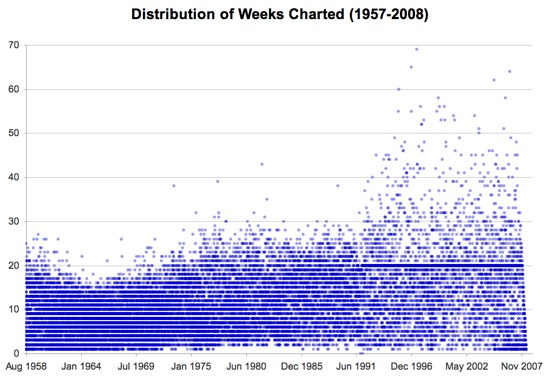
See the heavy dropoff on the 20th week starting in 1991? In an attempt to increase diversity and promote newer artists and songs, Billboard changed their methodology, removing tracks that had been on the Hot 100 for twenty consecutive weeks and slipped below the 50th position. These songs, called “recurrents,” were then moved to their own chart in 1991, the Hot 100 Recurrent.
Unfortunately, this shift makes it much harder to compare the last 15 years to the decades before it. In the chart below, I’ve isolated the effect by only showing songs that reached the top 50.
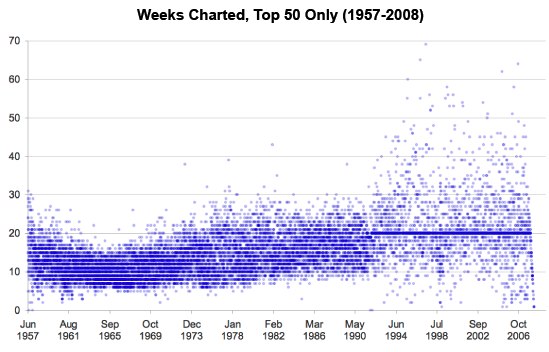
A couple interesting observations… Looking at the very bottom of the chart, you can see that in the last couple years, it’s become very common for a single to appear in the Top 50 and fall out of the Hot 100 within four weeks. Prior to the mid-1990s, this almost never happened.
Also, songs are staying in the Top 50 for far longer than they used to. Unfortunately, I don’t have any actual sales numbers to compare to, so it’s hard to say if these 30-70 week singles are massive megahits eclipsing the #1 singles of the past, or if it’s because the record industry is producing fewer hits than before.
Diversity
Did Billboard’s methodology changes in 1991 make the charts more diverse, like they hoped? By looking at the total number of unique songs that have charted yearly, it’s clear their changes did nothing to slow the decline.
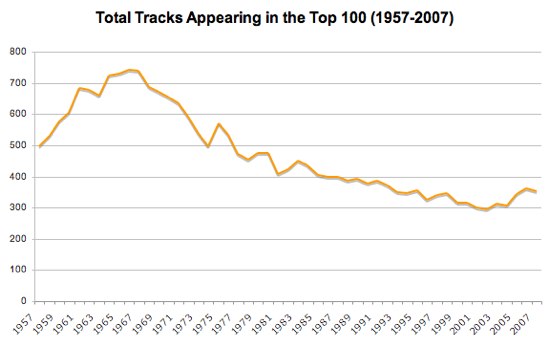
According to Billboard, the late 1960s were the peak of musical diversity in popular music, with 743 different songs appearing on the 1966 Billboard Top 100. It’s fallen consistently since, hitting an all-time low in 2002 with only 295 songs. Since then, it’s improved only slightly, with 351 unique songs appearing on last year’s Top 100.
One Hit Wonders
I’ve always thought the 1970s were the decade of the one-hit wonder, but now I have the data to see for sure.
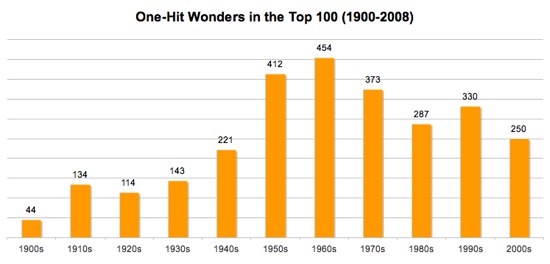
In raw numbers, the 1960s had more one-hit wonders than any other decade, followed closely by the 1950s. But that’s not entirely fair since, as we saw earlier, there were simply more unique songs on the 1960s charts. To find out the true numbers, we need to look at the number of one-hit wonders as a percentage of all songs in the Top 100.
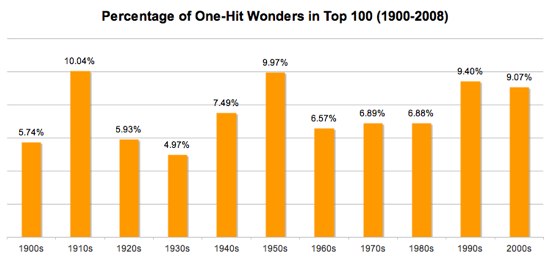
This tells a totally different story. The 1960s, 1970s, and 1980s all had about the same ratio of one-hit wonders to hits by more established artists. The big surprise for me is that 1950s, 1990s, and 2000s really seem to be the eras where one-hit wonders dominated the charts.
Joshua Porter was wondering about the longest-charting one-hit wonders of all time. The longest-charting one-hit wonder to hit the #1 spot is Daniel Powter’s “Bad Day” from 2006, which stayed on the charts for 32 weeks. The one-hit wonder that stayed at the #1 longest is Anton Karas’ “The Third Man Theme” from 1950, which stayed in the #1 position for 11 weeks. Finally, the longest-charting one-hit wonder to appear anywhere in the Top 100 is Duncan Sheik’s “Barely Breathing” from 1997, which peaked at #16 but stayed in the top 100 for 55 weeks.
Have any other questions about the data, or done any analysis yourself? I’d love to hear about it.
May 20: Don’t miss Mike Frumin’s chart of pop longevity,from 1998-2002.
May 21: Using the Whitburn data, Tom Whitwell generated a tag cloud showing the top 100 commonly-used words in song names. Dianne Warren should write a #1 hit called “Love my Baby Blue Heart: A Girl’s Night Song.”
July 14: Pedro did some additional analysis, including artists with multiple hits in the same week and one-week wonders.
I absolutely love gigantic pools of data.
Isn’t it a touch unfair to count one-hit-wonders occuring in the last year (or two)? Presumably at any given point there would be a decent number of artists with a huge debut hit, who would then wait a year or more to have their follow-up hits.
This brings up a potentially interesting analysis question…what’re the average times between hit songs for any non-one-hit artist, and has that changed over the decades? (Along with the standard, what’s the record distance between two hits by an artist, and who has the highest density (least distance) of hits (perhaps with minimum of 3, 5, and 10 hits?).
And that makes me wonder about any means of analyzing singles eras vs. album eras (and furthermore, any means of determining if the current digital age is statistically shown to be leading us back into a new singles era) but I’m not fully clear on how or what analysis would give us answers relating to those issues. (It’s perhaps an especially odd era now, just about all songs are on some album, but quite likely to be purchased separately from the album.)
Duncan Shiek FTW
Man, great list must have taken a long time to compile all this data. Not a lot of one hit wonders.. Just goes to show that not everyone can make it and if they do they just don’t have what it takes to do it again…
Wonder if there will be a follow up to where all these 1 hit wonders go after they’re hit?
Thats good to know.
Between this and your previous post, my mind has been officially blown. I’m thrilled there are people in the world like the compilers/creators of that list, and geeks like you (and eventually me) that will tear those lists apart looking for trends/patterns/anything. Very slick.
It would be interesting to take overall record sales and the number of records released into consideration. Assuming that the number of records released has increased while overall sales are decreasing, it must have become easier to get into the top 50.
The RIAA has some sales statistics here: http://www.riaa.com/keystatistics.php
This still does not explain why the overall quality of songs has steadily declined since the late 60s.
I love Duncan Sheik.
Simply amazing. I have to admit I am a “One Hit Wonder Junkie” most of the time. 😛
-Mus
I always wanted to know the total amount of possible pop songs that could ever be written. Yea, it’s a big number, but it’s not infinite.
Some parameters:
A pop song is in one of 11 keys.
Usually in 4/4 time.
A verse usually is 16 bars long.
A chorus is usually 16 bars long.
A bridge (if there is one) is usually 8 bars long.
Once you’ve written the verse/chorus and maybe a bridge, you normally just change the orchestration for the other verses/chorus. (but it’s the same song) If you broke each section down to 16th notes, you now have all the available “slots” to put a melody in.
The question would be what to call a viable variation on length of a pop song. You COULD write a 3 bar verse and a 7 bar chorus..but would it be considered a legit pop song? I bet if you just totaled up all the structural variatons of all pop songs for the past 50 years, you would have all the legit variations covered.
is that one dot thats really high around 1996-1998 the macarena?
Thanks for the great data and analysis. Fun stuff. Other ideas… query to determine things like:
hey andy,
nice post!
Here are some links to the 3 songs you highlighted. Does The third man theme really count as a one-hit wonder as it was the song for a TV show?
Bad Day: http://youtube.com/watch?v=oIcFgl6zf3A
The Third Man Theme: http://youtube.com/watch?v=cqVxVT796IE
Barely Breathing: http://youtube.com/watch?v=FryER9kXTE0
Wow. I’m really shocked that the 80s didn’t have more one-hit wonders than it did. That’s the decade people usually point to the most, IMHO – Toni Basil, Kajagoogoo, Nena, etc.
Andy, you could do six months of posts on this data. And I hope you do. Keep up the good work.
Andy Baio
Nice to see some science applied to the black arts! Gotta get the dollars involved somehow to really see what is going on.
The 60’s was a perfect storm for the music business primarily due to the boomers coming along and dumping HUGE amounts of money into the music business. Due in part to population demographics, and part to boom times economically.
On top of the unprecedented cash infusion, you have an unprecedented technology leap to multi track recording pioneered by those big names that don’t need repeating.
Add to that the gigantic talent pool due to the fact there were just many more people of the age interested in making pop music.
Inject some innovations by our Department of Defense in the mind expanding department, and BINGO! A great flood of material, and the one song in a thousand (ten thousand?) that IS a hit gets more frequent because the base line supply is so large.
Great work!
One nit in comparing the 2000s against other decades: the one-hit-wonder rate for the 2000s may yet go down, with followup hits-to-come.
This is awesome. Well done!
One other things that happened in 1991 (on November 30th, to be exact) was that Billboard switched to SoundScan, to better track actual sales. I can’t explain exactly why this had such a huge impact on the charts, but the change was immediate: There had been 25 different Number One hits in 1990, and 27 in 1991, but there were only 12 in 1992, 10 in 1993, and 9 in 1994. Between 1955 and 1991, only one song stayed at Number One for 11 or more weeks (“Don’t be Cruel”); from 1992 to 2000, eleven different songs stayed at Number One for at least 11 weeks.
I think you really have to divide the analysis between 1957-1991 and 1992-present.
Biks Wigglesworth wrote:
I always wanted to know the total amount of possible pop songs that could ever be written. Yea, it’s a big number, but it’s not infinite.
Google “melancholy elephants”.
Thanks for this. Really impressed. I’d love to see a zoom in of the graph from 2000 – present.
I think there might also be a correlation between average song length and number of unique songs, and hence with one-hit wonders. The average song in the 50s and 60s was much shorter than today. Not sure if the 80s are any different than today.
If you could somehow measure the average duration of “unique” songs played on the radio, it might be somewhat constant over the decades (e.g. on average, the most popular songs are played once every two hours, but in the 60s, you needed more songs to fill those two hours than you do today).
Thanks for the post, great stuff!
We need a Melodic Black Metal chart, also.
It’s easy, just put the two axis, and voila.
I would like to know the longest song to make number one…not counting two part songs like What’s I Say by Ray Charles.
Hey Jude?
Close! “Hey Jude” is the second-longest single-part #1 hit at 7 minutes 11 seconds. The longest is Justin Timberlake’s “What Goes Around… Comes Around” from last year, clocking in at 7 minutes 28 seconds.
To amanda: No, the one high dot is the 69-week charting “How Do I Live” by LeAnn Rimes.
Love this stuff! Does Whitburn or Fred Bronson at Billboard know about this?
Whatever happended to the group The Nation Funktasia?
Did my own little initial review of the data and posted some interesting bits I found while looking through. I expect to play with that data quite a bit more, but it’s a start.
isnt it being completely ignored here the fact that there are more people now than in the 40s and also we have much more access to much wider more diverse music to satisfy tastes? everyone has different tastes that dont necessarily relate at all to the charts etc. some poepl only watch live bands, they dont buy cds in shops etc.
this data is wicked! really interesting, iespecially love diagram 1 with the blatant line as a result of the marketing of music but its kinda doomed by the nature of the consumption of music today! Who / how would the data be compiled to reflect what people r actually listening to / the effect of art on the masses (music).
When you analyze the numbers of hits in various decades, are you really analyzing the hits? Or is it more of an analysis of the people charting the hits? What is the exact mix and how can you determine it?
I like the one hit wonders percentage section. That is very informative. Great job.
Here’s a site with like 1000 one hit wonders:
http://tunecaster.com/one-hit-wonder.html
My analysis very much depends on Billboard’s methodology for determining chart success, which has changed over the years. Unfortunately, they don’t expose raw sales numbers, making it very hard to do objective analysis.
Always loved the “Whitburn List.” A truely unique source of info of the music that one can enjoy. Now if only someone would put the lists on the internet at a web site, others could enjoy that as well.
I wonder how the artist names over the last 20 years were entered into the database. Seeing how many established artists teamed up with other artists, there were MANY songs billed as “Name1 featuring Name2” and whereas Name 1 and Name 2 had several other hits either as a solo act or as a featured artist in another song.
For example, a current hit single on the chart is billed as “David Guetta Featuring Akon”. In this example, Akon has had several hits, but has only appeared on the HOT 100 once as “David Guetta Featuring Akon.” Likewise, David Guetta will likely chart again as a solo artist or as a featured artist. Maybe this explains the influx of “one hit wonders”?
Just a thought.
Lots of interesting data & comments.
I’m quite curious about the solid dark blue line at 20 weeks in the second chart. Is that somehow tied into recurrents?
THANK YOU!!!!! This was perfect in helping me define pop music and its lack of staying power for my english class.. THANX!!!!!!