Girl Talk’s Feed the Animals is one of my favorite albums this year, a hyperactive mish-mash sampling hundreds of songs from the last 45 years of popular music. Gregg Gillis created a beautiful, illegal mess of copyright clearance hell, which you should download immediately. (It’s free, but I kicked in $20 for Gregg’s legal fund and a copy of the CD.)

Last month, Rex Sorgatz asked about collecting metadata on the album for data crunching. After spelunking through Billboard’s chart history, that sounded like my idea of a good time.
So I compiled all the data into spreadsheets, used Amazon’s Mechanical Turk to collect some additional information, and pulled out a few charts. As always, I’ve provided CSV downloads for all the data along with the original output from Mechanical Turk, for those interested in experimenting with the platform.
Update (October 30): Here’s the official sample list.
Results
Here’s the final spreadsheet with all the collected data. You can download the CSV or browse it using Google Spreadsheets. For more information about how the data was collected with Wikipedia and Amazon’s Mechanical Turk, I wrote about my methodology in the next section.
There are 14 tracks on Feed the Animals, with a total of 264 sampled songs. “What It’s All About” and “Like This” have 26 sampled songs each, tying for the most, while “Don’t Stop” has the fewest at 11 songs. Overall, the album averages 19.8 songs sampled per track.
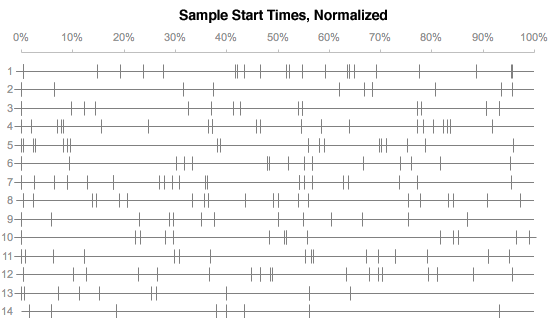
The timeline below shows where each sample was triggered across the entire album, as a percentage of the song’s duration. (For example, a marker at the 50% mark on the 9th line means that a sample started halfway through track #9, “Hands In the Air.”) You can get a sense of the flow of the album, how Gregg spaces samples apart and occasionally switches moods entirely by introducing three samples in quick succession.
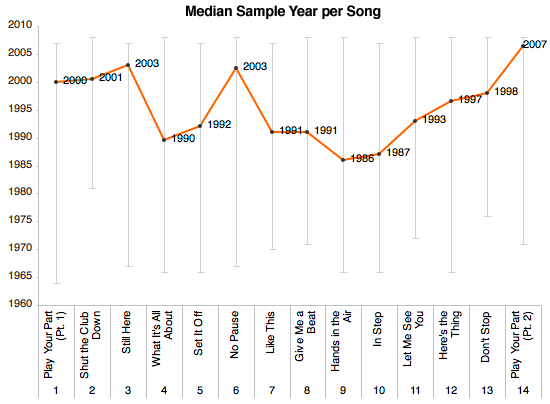
Using the sample release dates collected from Mechanical Turk, the chart below shows the median sample age for each track. (The bars above and below each point represent the earliest and latest years for each track.) I was surprised to see a trend — the album uses relatively recent songs for the first three tracks, before taking us back to the late ’80s and early ’90s for the middle of the album, with the exception of “No Pause.” Then, every song from track 9 to the end of the album gets progressively more modern. For the whole album, 1995 was the median year.
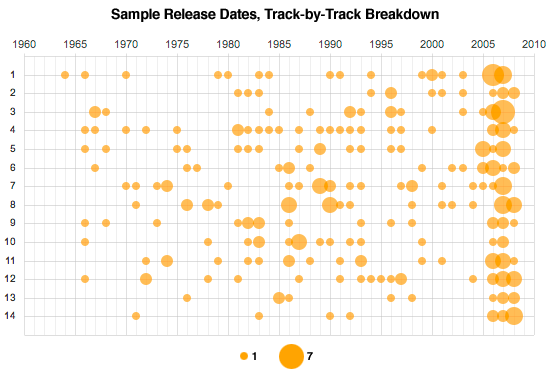
The chart below shows the sample release years in more detail, telling another story. Here, we can see how heavily Gregg uses samples from the last three years, and strongly avoids samples for the previous three-year period from 2001 to 2004. (Too old to be cool, but not old enough to be retro?)
I’m sure there’s more that can be explored here, so feel free to send on your own analysis.
Methodology
Getting the sample list was easy. I took a snapshot of the album’s Wikipedia entry and extracted all the samples using Excel’s Text to Columns feature.
Now, I had a spreadsheet of all 264 songs sampled across 14 tracks, with each sample’s original artist and song name. But to get the sample’s release year, I’d need to go elsewhere. The Last.fm and Yahoo! Music APIs all support album release dates, but during testing, I found that the dates were unreliable. (Compilation albums and reissues led to incorrect dates, and some artist/song searches led to incorrect results.)

Instead, I decided to use human labor to fill in the gaps using Amazon’s Mechanical Turk. I created a new request using the new web-based tools for generating HITs (or “Human Intelligence Tasks”) from a simple spreadsheet.
I paid $0.02 for each request, with each song verified by two different workers. Each worker was asked to search for the song on Billboard.com, All Music Guide, Wikipedia, or Google, and fill in the original release year. Here’s an example of one of the requests.
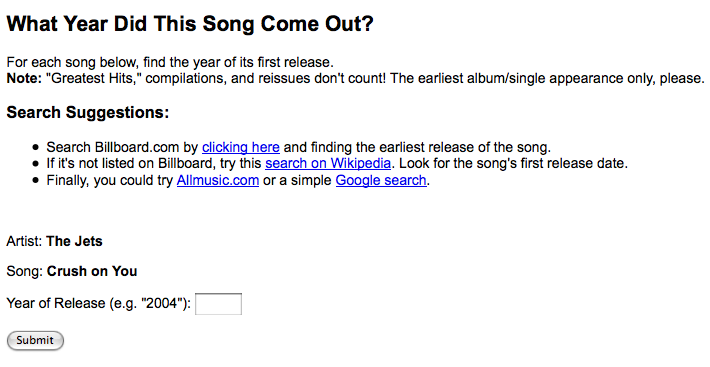
Within an hour, all but 4 answers were submitted. The median time to finish a request was an impressive 26 seconds. (Amazingly, over 110 answers were completed in under 10 seconds without any errors.)
For 193 songs, about 73%, the two workers agreed on the year, so were approved immediately. For the rest, 27% of the songs, the workers came up with different answers, so I checked them manually. (In hindsight, I should have required three workers per song to resolve different answers.)
Surprisingly, I couldn’t find a correlation between the amount of time spent on each task and the error rate. Workers who made mistakes took just as long as the accurate workers.
The spreadsheet below is the source data from Amazon’s Mechanical Turk. (View it on Google Docs or download it in Excel format.) The “raw” sheet is the default output from Amazon, while the rest of the sheets are my own edits, breaking out the final set of accepted answers, the responses that were immediately approved, and the ones that were contested.
Overall, it cost me $13.20 for all 528 answers and took a little over two hours, an hourly rate of about $1.64. Simple to use, affordable, and I’ll almost certainly use it again — for something a little more interesting next time.
If anyone out there wants to take a pass at getting the sample endings, sample genres, or any other additional metadata with Mechanical Turk or otherwise, send it along and I’ll add it to the spreadsheet. Thanks!
Update: If you’re in the San Francisco Bay Area, you might want to wrangle an invite to Yahoo!’s Open Hack Day in Sunnyvale tomorrow. Hint, hint.
October 30: Here’s the official sample list.
This is awesome. Turk FTW!
Three of my favourite things – music, data and good old mashups! Splendid.
I was looking for this type of analysis ever since I saw Wired’s visualization here: http://www.wired.com/special_multimedia/2008/pl_music_1609
It’s fun to follow along the song, and try to identify the samples as they come up. It’s made it very clear that he often starts up three samples at a time for mood shifts when seeing it in that form.
After seeing Wired’s take, I wanted to see this type of chart for every song, and this data is a start, but it looks like you need the sample end times as well in order to really make that chart. And if someone does create those charts, then having the text upside down at the bottom makes it a lot more difficult to read
Also, I believe that the main vocal tracks are listed as the inner most circles, and the more background tracks along the outer edges.
For reference, Wired’s visualization of “What’s It All About” is track number 4.
Thanks for gathering this raw data!
I’d find it interesting, on the copyright front, to have columns on the sheet for length of the individual samples.
Unfortunately, I’m also feeling like it’d be nearly impossible…Presumably it’d need to be Turked, where people were given an audio clip starting a second before the sample start time given above and asked to note when the sample ended, but given sample editing, repeating, and speed-shifting it might be difficult to even come up with a strict definition of ‘time’.
Of less importance, but still interesting to me would be to determine the timestamp in the sampled song where the used sample came from. Does Gregg mostly sample from intros of songs, the breakdown, vocal hook, or does it completely vary? Again, it’s hard to imagine you could reliably get this data from the general workers without needing to do 5-10 times redundancy verification.
Yeah, I couldn’t think of a way to reliably get the end times without collecting all the original songs for comparison. I mean, how many random turkers are going to know the difference between Young Leek’s “Jiggle It,” Spank Rock’s “Put That Pussy on Me,” and E-40’s “Tell Me When to Go”? They all start at about the same time on “No Pause,” but without hearing the originals, it’d be very hard.
The Wikipedia contributors had a brief debate about whether to include sample stop times. “Would it be too difficult to also have the times that the samples end?” “Yes.”
But don’t let that stop you! I’d love for someone to take a shot at it.
Well done, Andy.
Wondering, what tool do you use to create your graphs? Or is that all in Google Docs?
Microsoft Excel! It takes a bit of work to de-uglify their default charts, but it’s possible. The last chart, for example, is their default bubble chart with all the fonts and colors changed, and the bubbles set to 50% transparent.
This seems like the most ideal use of a resource like MT–a large dataset that can be broken down into many small jobs (similar to the @home projects). If I may ask, what did you use for graphing/charting?
Oops, sorry. That’s what I get for not refreshing. Thanks!
I assume the paucity of 2001-2004 tracks is due to his having borrowed more heavily from this period for “Night Ripper,” his previous album.
@man: Duh! That makes so much sense. Thanks.
Great stuff and enjoyed the music as well! 🙂
Yeah, I couldn’t think of a way to reliably get the end times without collecting all the original songs for comparison.
How about Youtube?
I’d love to see the same thing done with his previous album, Night Ripper, to see how much (if at all) Mr. Gillis changed stylistically.
Once you put in a payment, they let you download, regardless of whether or not you complete the transaction. What’s the point?
I agree with flatluigi. It’d be interesting to also see the genre cross-over from album to album. It seemed like Feed the Animals had a lot more recent hip-hop/rap, am I correct in this? However this is excellent. Loving the data, opens many chances for conversations where I look like the smart one.
Is it just me, or is this math confusing?
Glad you asked! The “effective hourly rate” is reported by Amazon, and it took some digging to figure out how they’re calculating it.
While it only took two hours to complete the whole job, it took all of the workers a collective 6.6 hours (or so) of individual labor working in parallel. I paid out $10.56 to them (before Amazon’s fees), which is an average pay rate of $1.64/hour per person.
At an 80 hour work-week, that’s a yearly salary of about $6,800 before taxes. The big question: is it exploitation? Before you answer, read these answers from a random sampling of turkers about why they do it.
I love the non-stop mashups of Girl Talk (in fact I’ve got tickets to see him next time he’s in Toronto), so this was fascinating.
Mechanical Turk is a really interesting service — I hope I get a chance to use it for something in the future 🙂
great analysis. did you see the chart wired did for one of his songs?
http://www.wired.com/special_multimedia/2008/pl_music_1609
was at girl talk’s show last night at yahoo’s open hack day. it rocked!
http://www.flickr.com/search/?w=all&q=hackday08+girl+talk
Andy, I really dig the information you’ve provided here and especially appreciate you posting it free for everyone to read. As I now review the comments, I see someone else has said what I came here to say – that 2001-2004 was probably represented better on night ripper and his two other earlier releases. It would be interesting to see similar data for those albums, as well, if you ever feel the urge to torture yourself with more girltalk analysis.
Wow I thought Gregg was a big nerd, but you’ve got him beat! 😉
GirlTalk put on a good show (and managed to keep at least some of his clothes on, he’s known for ending up performing “in the nude”) at Y! Open Hack Day last weekend.
Related to this, I feel compelled to mention DJ Food’s amazing “Raiding The 20th Century”, a huge mash-up of pop songs and story-telling including classic audio recordings (“I am sitting in a room”, etc.) – http://www.scissorkick.com/2005/02/dj-food-raiding-20th-century.html – apologies if you’ve covered this before, a quick search didn’t turn up anything.
That’s a lot of boys talking about an album called girltalk.
Just saying
This is great analysis, but is tainted from the out set.
The sample count is closer to 300 for this album as reported by both Wired (http://tinyurl.com/67uq72) and Rolling Stone (http://tinyurl.com/4y733n). The aggregate data here is surely at least close, thought not entirely correct for the simple fact that some 40 samples aren’t represented at all in the original data from Wikipedia.
Until Gregg releases his official sample list, it’s the best we can get. This covers all the major samples of significant length. Anything not covered is either too short to be detectable, or inaudible, buried in the mix.
Also, it’s unlikely to affect the charts much since we have such a large sample.
Fantastic use of MTurk!
Just (finally!) got the CD of this release today…there are definitely more samples than those ‘discovered’ in the Wikipedia article. I know this because Gregg kindly included a ‘Source Material’ list in this release, and there are 2 INXS songs listed (INXS is one of my favorite bands, so I naturally noticed them first), but only one – ‘Need You Tonight’ listed in the Wiki article.
The only downside is that the ‘source material’ list is in artist alphabetical order, not song orrder, so not too much help in further matching up the missing samples with their song placement. 🙁
Here is an image scan of the ‘Source Material’ insert from the CD release.
http://www.flickr.com/photos/sjheil/2968758633/
I also scanned it to PDF…if anyone is interested in that, feel free to drop me a note.
p.s. I’ve read in interviews with Gregg that some of his samples are as short as a beat-slice, so it may be difficult (…impossible?) in some cases for us mere mortals to figure out where the missing samples really are.
How fascinating! Thanks for sharing your ingenious research, which is as amazing a compilation of loose bits as the Girl Talk album. 🙂
For album release dates, http://www.musicbrainz.org/ is good source for data. This data is maintained and edited by individuals.
something I noticed, the Body Movin’ version is not the Beastie Boys one.
Sorry, I was wrong. It is the original version from “Hello Nasty”.
Yeah. Great analysis of emotion into non-emotional data. I’ll sit here for hour excited by it all. Whooo
On another note: GT is less exciting, even boring. Reminds me of those ‘meaningful’ samples first appearing on Front 242 jezuz, maybe two decades ago. Of course, EBN EMERGENCY BROADCAST NETWORK did this stuff about 12-15 years ago with video and movies no less. GT seems retro and hardly worth a favorite album award from anyone nevermind Time mag. Very odd.