Techcrunch acquires FuckedCompany
— hedging bets by covering both the rise and fall of startups; if it's an April 1 joke, it really shouldn't be #
Justin.tv hits the front page of the SF Chronicle
— watching the cam right now is very meta, as he walks around SF with people recognizing him #
All (known) Bodies in the Solar System Larger than 200 Miles in Diameter
— like the MegaPenny Project for celestial bodies #
This American Life's first TV episode in its entirety
— yay! plus, the newly redesigned TAL website (via) #
Playing from the Other Side: the Discomfort of Militainment Avatars
— great stuff, including an Iraq vet who refuses to play for the insurgents and an insane FPS published by Hezbollah #
The 'I Heart Huckabees' Outtakes
— David O. Russell and Lily Tomlin go completely unhinged; NSFW language #
Understanding Avatars in Games and Social Media
— great reading with many visual examples; Gordon's been on a tear post-SXSW #
Letterhead Fonts embrace DRM with disastrous results
— the foundry that made the Upcoming.org logotype goes to the dark side #
Video: Chris Ware animation for Showtime's This American Life
— wonderful story about how make-believe cameras changed an elementary school playground (via) #
A Conversation at the Grownup Table, as Imagined at the Kids' Table
— "Pass the wine, please. I want to become crazy." (via) #
Handy list of TLD meanings, prices, and registrars
— correction: Thailand charges 2505 Baht for .th domains, not USD (via) #
Khoi Vinh's "Grids are Good" presentation and slides
— however you feel about his design, this is a must-read #
Delutube, the Deleted YouTube Video Viewer
— deleted videos apparently remain on YouTube servers, for the moment (via) #
How Zug Hacked the Super Bowl
— John Hargrave and Rob Cockerham are my idols; unfortunately, unreadable (via) #
Tracking Twitter's Message Growth
By now, everyone knows that Twitter exploded at SXSW and everybody’s seen the Alexa charts. But this is mostly a mobile app, so pageview traffic is only part of the story. How fast is Twitter really growing?
I decided to find out by using Twitter’s founder Evan Williams himself, albeit indirectly. Since Ev’s Twitter history goes from message #28 in March 2006 to #8,281,991 about three hours ago, it’s a convenient snapshot of Twitter’s growth since it began. Update: The data from November 2006 to present is faulty, since they apparently switched to non-sequential IDs. More information below.
I threw it all in Excel and charted the sequential IDs and dates for each of Ev’s 1,226 messages. The moment SXSW started, Twitter’s growth curve changed radically and hasn’t slowed down. (The huge orange bar for March is only half the month.) But more interesting to me are two other dates: November 23, when Twitter’s growth rate sped up drastically and then on February 5, when the rate seriously slowed. Are there problems with my data? If so, I can’t find it. If you have any sense of what triggered those changes, please comment and let me know.
To help with your search, and any other visualization, I’ve posted the full Excel spreadsheet with inline charts and tables. Enjoy!
Note! The last three are cumulative charts, not month-to-month growth numbers. That means there were not 8 million messages sent this month, but 8 million total since Twitter started.
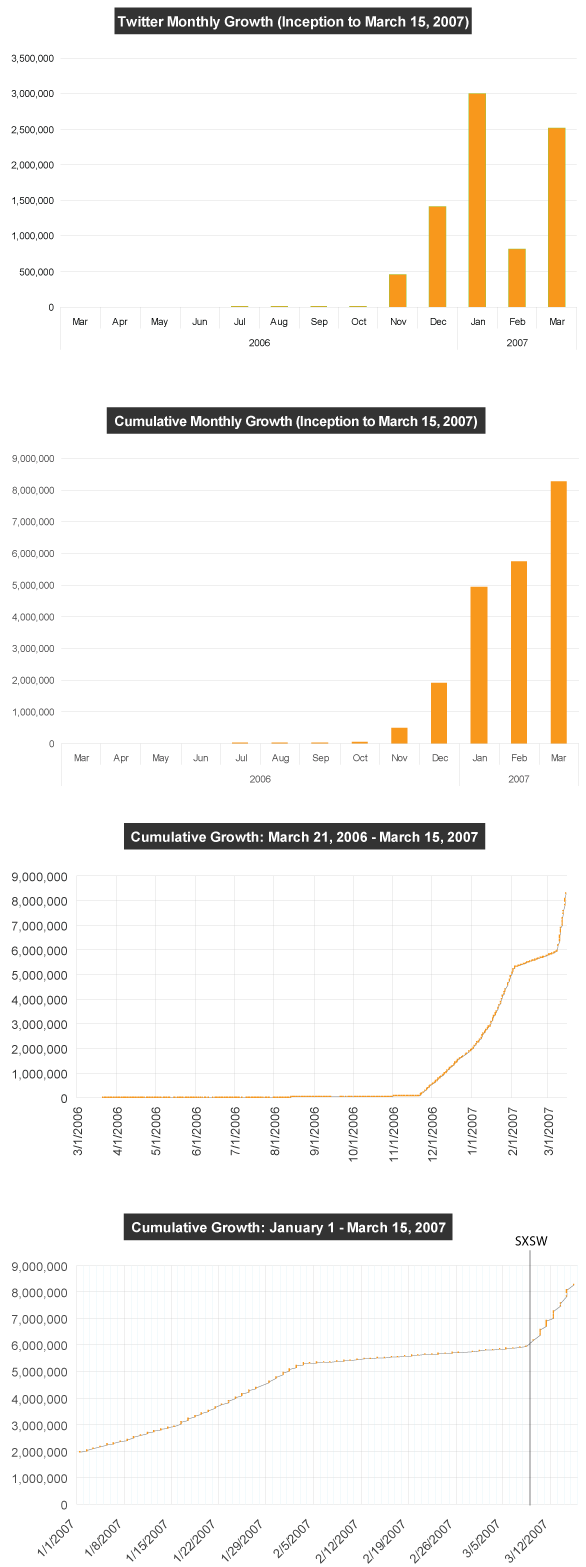
Update: Jason and I just discovered that the IDs since November 2006 have not been sequential, rendering these charts useless. The jumps in activity were largely artificial. Jason has more information.
DMCA Abuser Apologizes for Takedown Campaign
— the apology video is enjoyable; here's hoping he disappears for a while #
Girl Talk, DJ Drama, and mashups discussed on floor of Congress
— Congressman Doyle rocks the House (via) #
Waxy and Upcoming.org go to SXSW Interactive
— if you're going, come to the Yahoo! BarTab party and say hi #
Top 100 most-viewed pages on Wikipedia
— funny to see Heroes, Lost, and the Battle of Thermopylae appear; the latter because of 300 #
Khoi Vinh, Zeldman, and Greg Storey join the Deck
— yay! three of my all-time favs join the little ad network that could #
This American Life's Ira Glass on storytelling
— with tips specifically for vlogs, but applies to anyone who does presentations of any kind #
Yahoo! Answers adds friend network
— seeing questions and answers from friends is wonderful, but there's no way to search for people #
Apple: America's best retailer
— history of the Apple stores, and the fun factoid that Apple makes more per square foot than Tiffany's #
Scribd, like YouTube for documents
— Jason Scott, who runs a massive document archive himself, comments on the ethics of Scribd #
Video: Hands-on demo for Little Big Planet for the PS3
— don't miss this; deeply innovative and quirky toy/game, possibly worth buying a PS3 for (via) #
Details on PS3 Home, their MMO world with media sharing
— watch the video; I'm looking forward to communal viewings of bootleg TV shows #