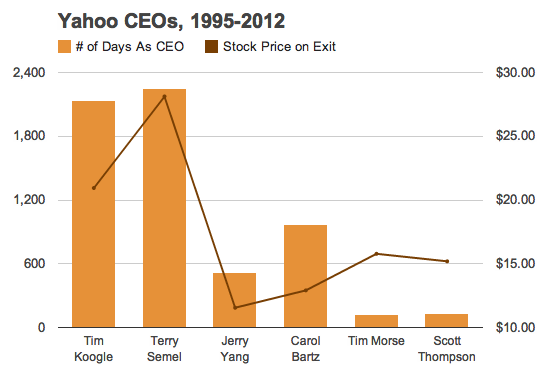
Just for the hell of it, I charted the tenure for every one of Yahoo’s CEOs against the starting and ending stock price. Man, what a mess.

Just so nobody else ever has to do this, here’s the data, culled from Google News reports and YHOO stock quotes. Download as a CSV.

Interesting analysis. Lost here is that the stock price actually went well into the $100s under Koogle! (As a former employee/shareholder, I can tell you that hurt. A lot.)
Not that you graphed it, but it’s in your spreadsheet… Never subtract stock prices! Always divide. And maybe take logs. (Yes, you’ll divide by zero, but that’s no worse than what you got this way.)